I use VictoriaLogs as the log store in my personal Kubernetes cluster. Compared with Loki, it uses fewer resources and is simpler to install and operate, making it suitable for small environments.
Although Grafana officially supports VictoriaLogs as a data source, autocomplete and the Explore UX are not yet as smooth as Loki’s, so I often ended up going back to vmui.
Then I discovered a project called loki-vl-proxy. It is a proxy that uses VictoriaLogs as a backend and provides Loki API-compatible endpoints, so from Grafana’s perspective it behaves just like Loki. The idea is to store data in VL and query it using the Loki UX, so I decided to deploy it right away.
Architecture
As the name suggests, loki-vl-proxy is a read-only proxy. The push (ingestion) path is blocked, and only Loki’s query API is proxied to VictoriaLogs. In other words, log ingestion stays as it is—vlagent/OTLP/Loki push → VL—and a Loki-compatible layer is inserted only in the query tier.
┌─────────────────┐    LogQL     ┌──────────────────┐    LogsQL    ┌──────────────┐
│ Grafana /       │  /loki/api/* │  loki-vl-proxy   │              │ VictoriaLogs │
│ Drilldown / CLI │ ───────────▶ │  (translator +   │ ───────────▶ │   :9428      │
│                 │              │   cache + guard) │              │              │
└─────────────────┘              └──────────────────┘              └──────────────┘
Internally, the proxy is roughly composed as follows.
- API Layer — Exposes Loki HTTP/WS APIs directly, including
/loki/api/v1/query,query_range,labels,series,tail,patterns,rules, andalerts. Grafana only needs to connect to it as a “Loki data source,” so no separate plugin is needed. - Guardrails — Operational guardrails such as tenant isolation (
X-Scope-OrgID), rate limits, circuit breakers, and fanout limits. - Translator — The core component: a LogQL → LogsQL translator. It converts stream selectors, pipeline parsers, range functions such as
rate()/count_over_time(), and label filters into VL query syntax. Semantics that exist in Loki but not natively in VL are handled by the proxy. - Cache layer — A four-tier structure.
Tier0compatibility-edge: cache compatibility conversion results (eliminates repeated conversion work)L1memory: hot-path in-memory cacheL2disk: reuse previous windows (optional)L3peer: share with peer pods in the fleet (optional)query_rangesplits long ranges into smaller windows for caching and keeps only near-now data at a short TTL, reducing the cost of long-range queries.
- Rules/Alerts Bridge — Converts
vmalertrules/alerts state into the Loki ruler API schema, making it compatible with Grafana’s Alerting tab.
As a result, Grafana believes “it’s connected to Loki,” while VictoriaLogs believes “queries are arriving as usual in LogsQL.” The proxy takes care of the translation, caching, and guardrails in between.
ArgoCD Application
The Helm chart is published in an OCI registry, so it can be connected to directly from ArgoCD. I configured it as a multi-source application so the values are managed in a separate GitOps repository.
apiVersion: argoproj.io/v1alpha1
kind: Application
metadata:
  name: loki-vl-proxy
  namespace: argocd
spec:
  project: default
  sources:
    - repoURL: ghcr.io/reliablyobserve/charts
      chart: loki-vl-proxy
      targetRevision: 1.8.1
      helm:
        releaseName: loki-vl-proxy
        valueFiles:
          - $values/envs/prod/loki-vl-proxy/values.yaml
    - repoURL: git@github.com:yourorg/gitops.git
      targetRevision: main
      ref: values
  destination:
    server: https://kubernetes.default.svc
    namespace: observability
  syncPolicy:
    automated: { prune: true, selfHeal: true }
    syncOptions: [CreateNamespace=true, ServerSideApply=true]
values
The chart’s default values can be found on GitHub.
At a minimum, you need to change .extraArgs.backend. Set it to the address of the VictoriaLogs service in the same cluster.
extraArgs:
  listen: ":3100"
  backend: "http://victoria-logs-victoria-logs-single-server:9428"
I set listen to :3100 to match Loki’s default port and reuse the existing Grafana data source settings. If you plan to use Drilldown, you can leave extraArgs.patterns-enabled=true (the default) as is.
Deployment complete
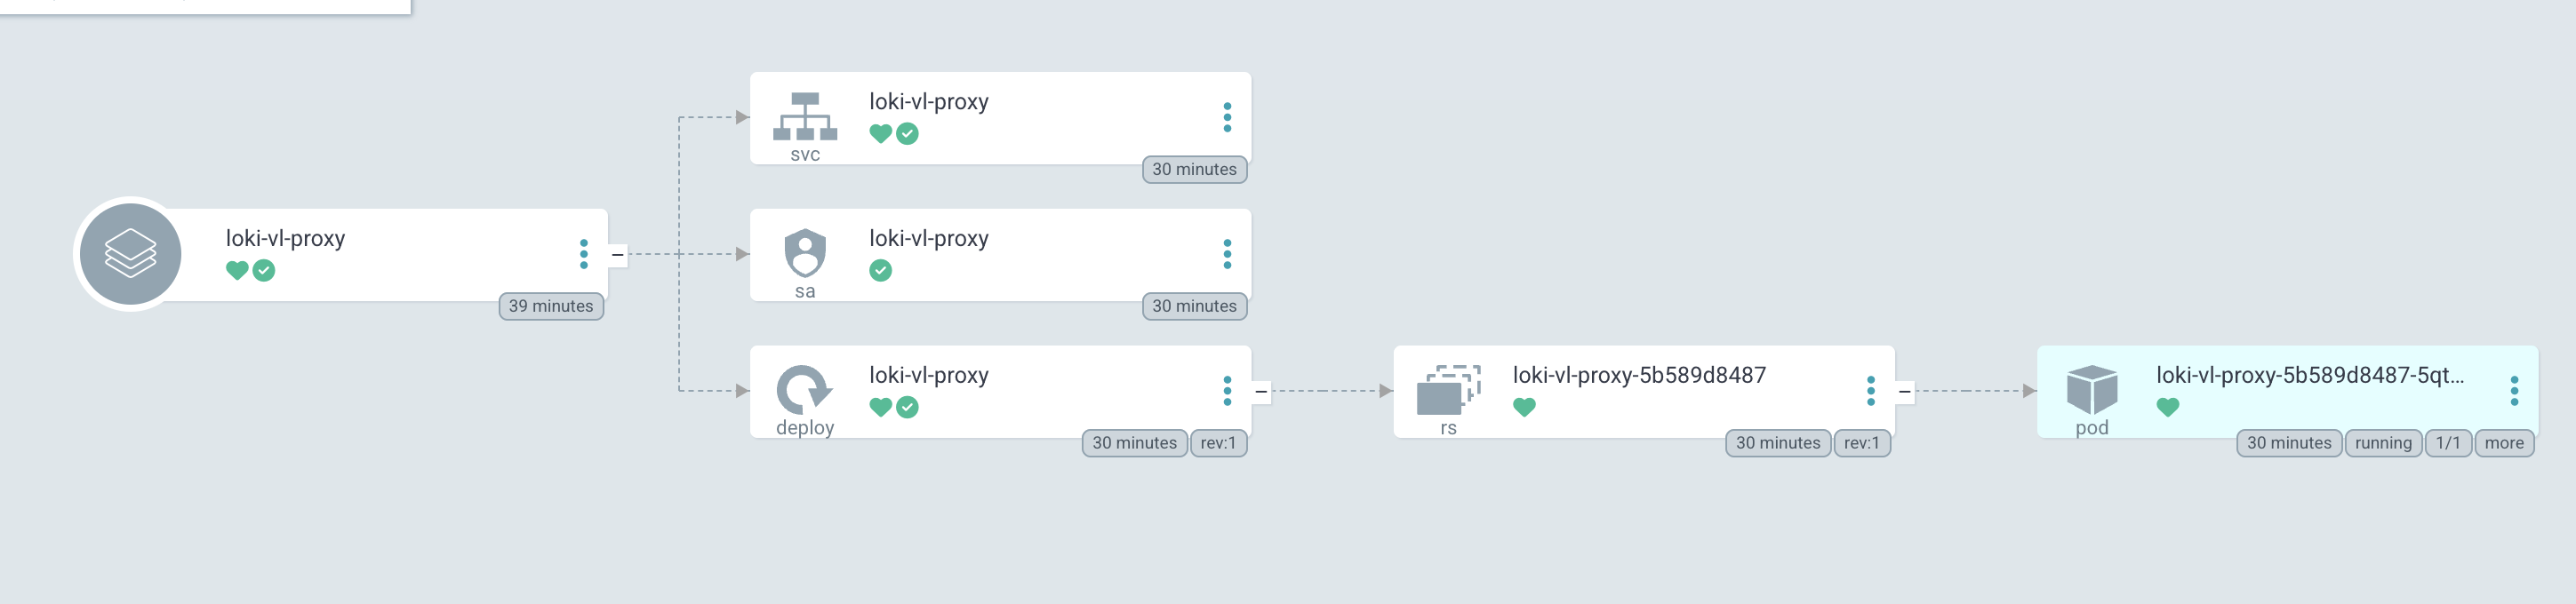
Now that the Pod is running, I’ll connect from Grafana.
In the Grafana data source settings, choose type Loki and set only the URL to the loki-vl-proxy service address. No plugin installation or other configuration is needed.
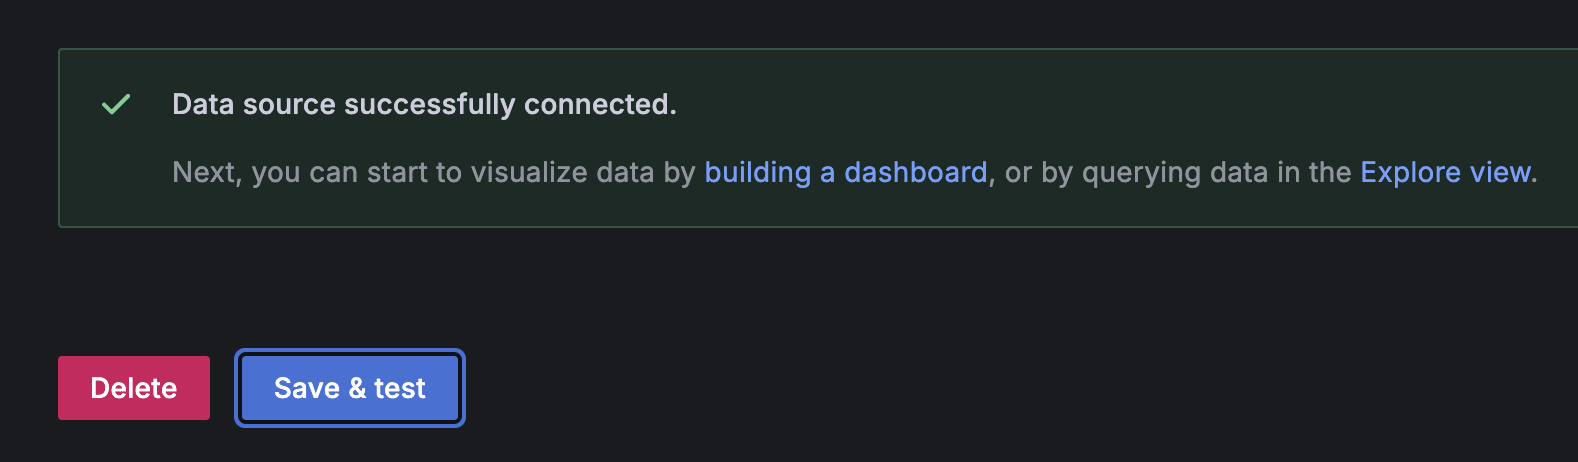
Result
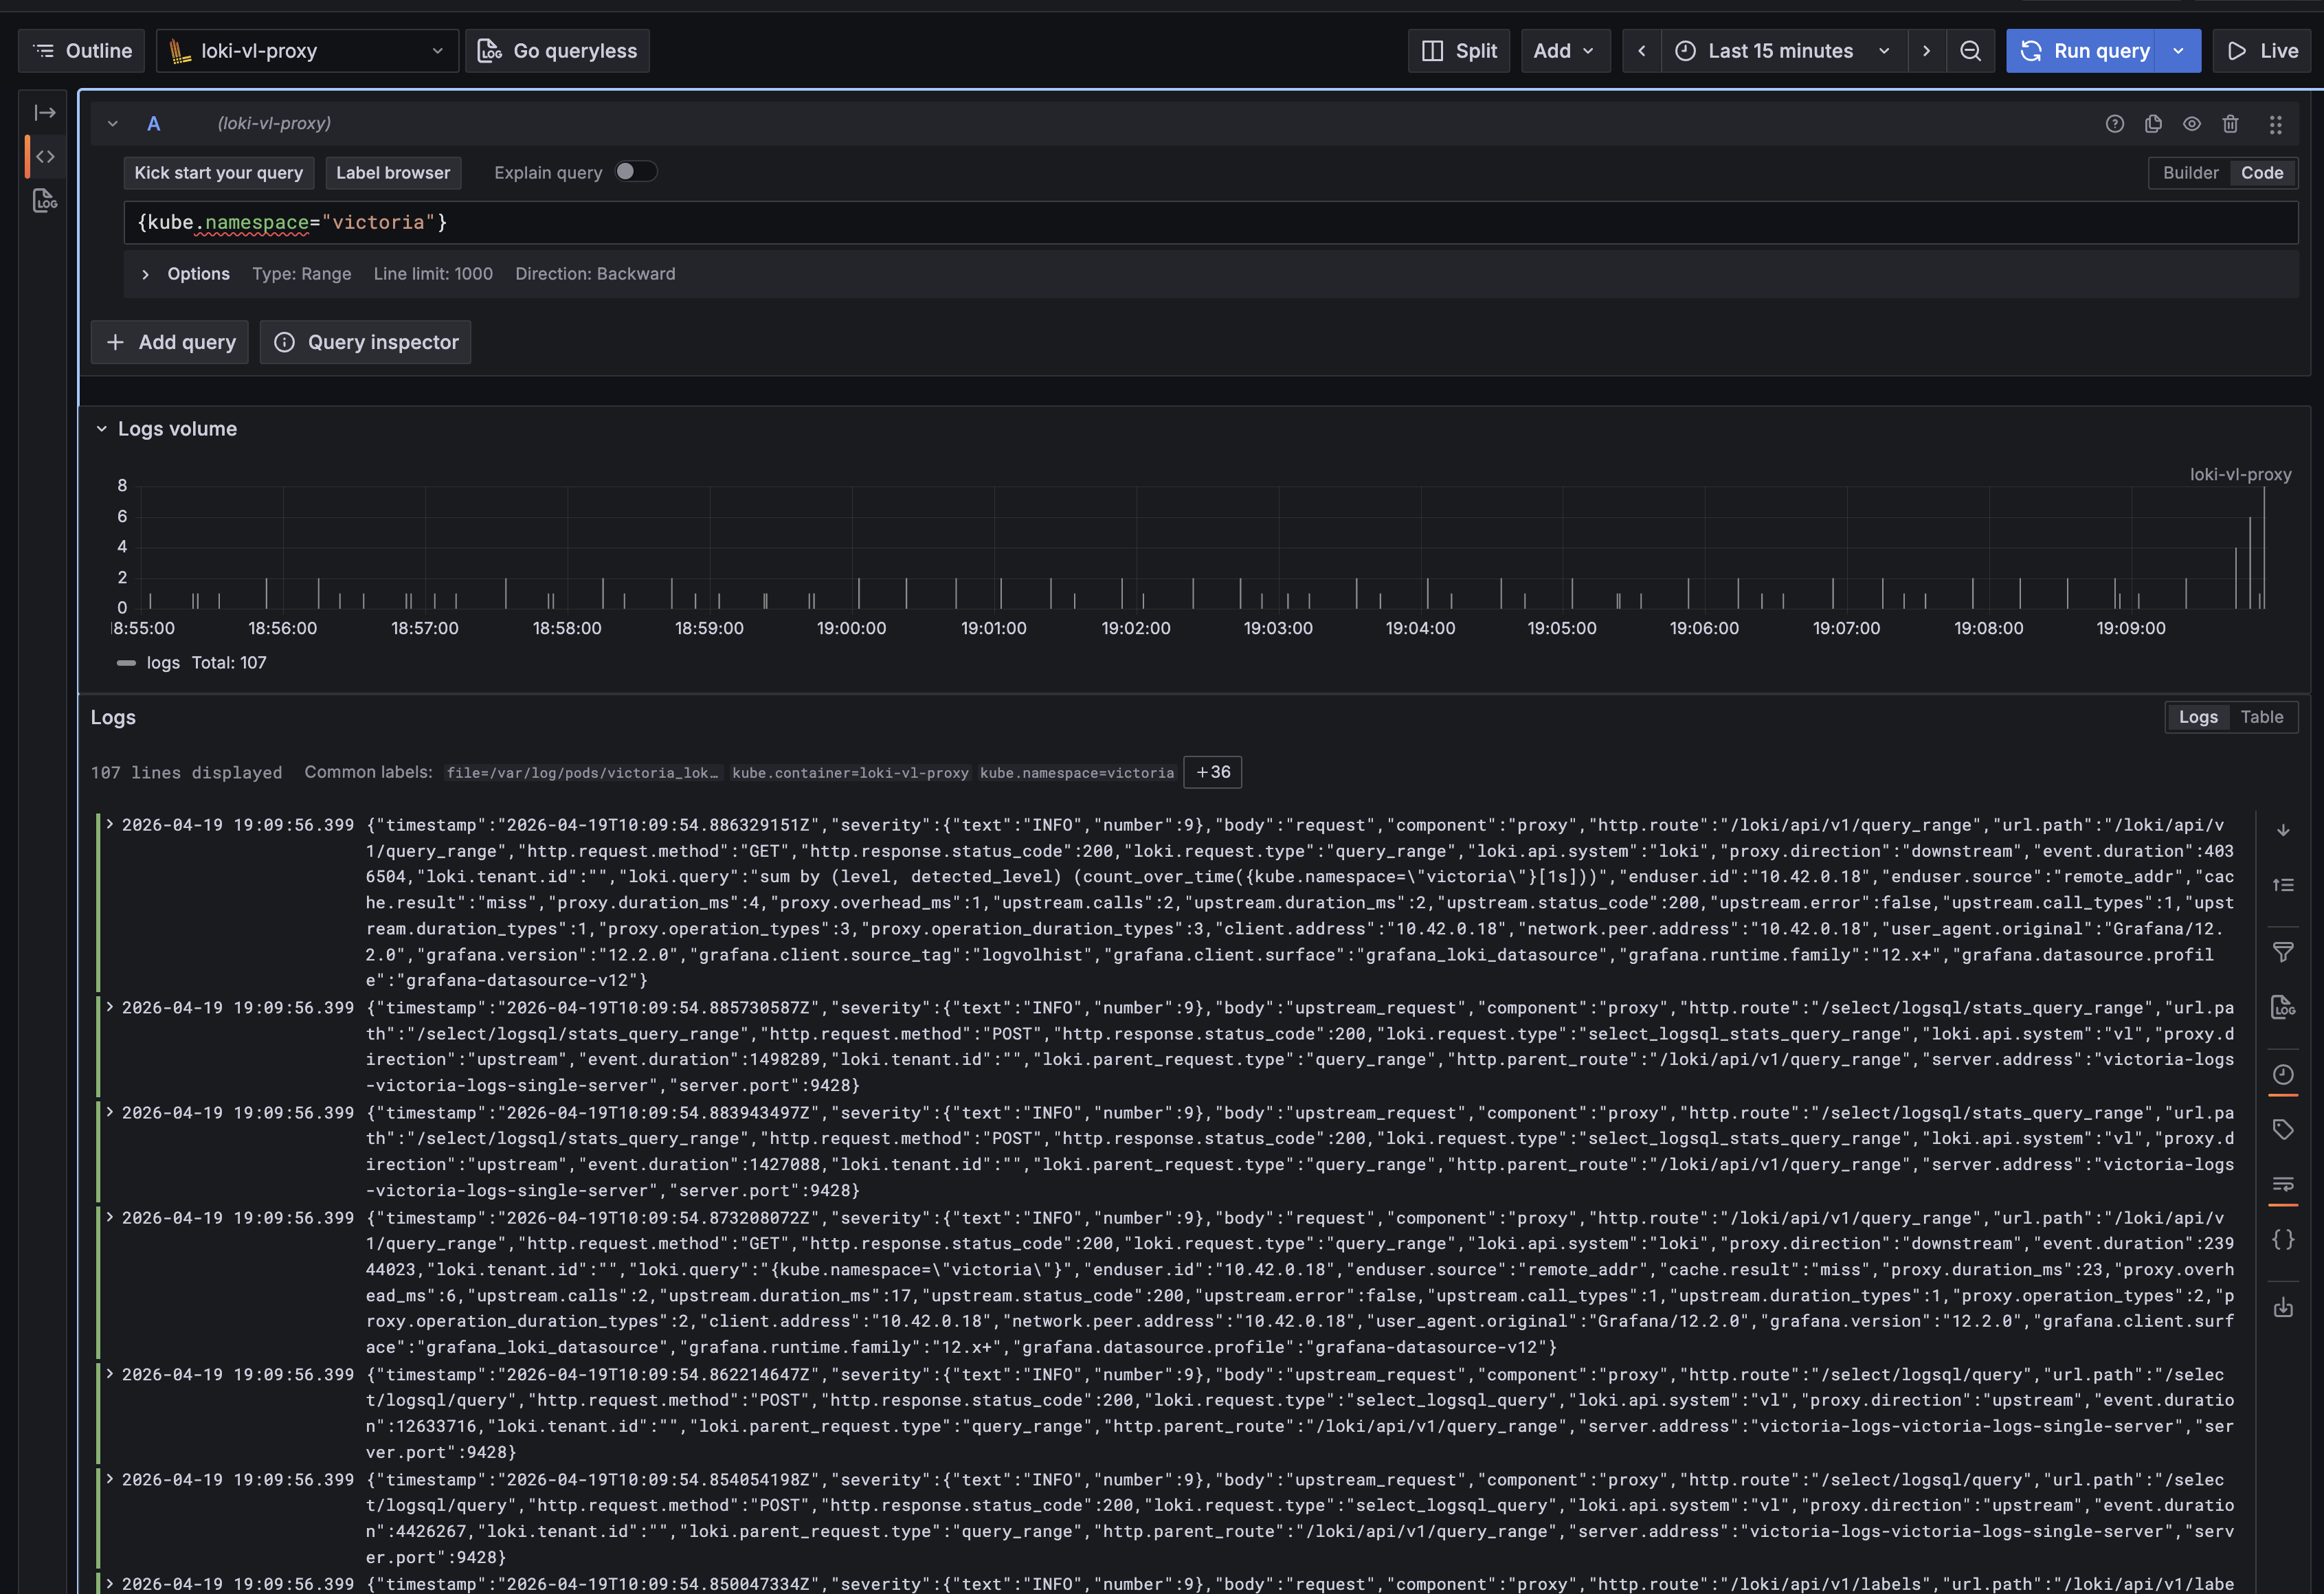
The log store is VictoriaLogs, but queries are written in Loki syntax (LogQL). Because loki-vl-proxy converts LogQL to LogsQL, Grafana sees it as an ordinary Loki data source.
As a result, I can keep using Explore autocomplete, Drilldown, and existing LogQL-based dashboard/alert assets, while retaining the lightweight VictoriaLogs storage.
It seems like a very good option in environments that are familiar with Loki’s UX but find Loki operations burdensome, or that want to use VL because they are already using the VictoriaMetrics ecosystem.
>> Home